|
Article Contents
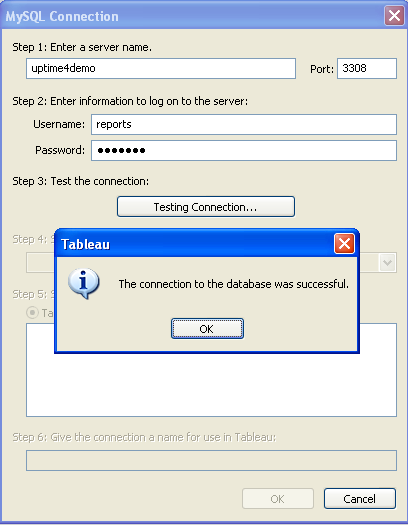
While up.time offers powerful reporting features, you may want to generate reports that use a specific set of data or a custom report format. Using Tableau, you can retrieve data from the up.time DataStore and use it to create reports that meet your individual requirements. For a functional example of how you can use Tableau to create reports, see this posting on the uptime Community Forum. If you have not already done so, install the MySQL ODBC driver and create a data source to access the up.time DataStore. For more information, see the Connecting to the up.time DataStore via ODBC Knowledge Base article. Configuring a Report in Tableau To configure a report in Tableau:
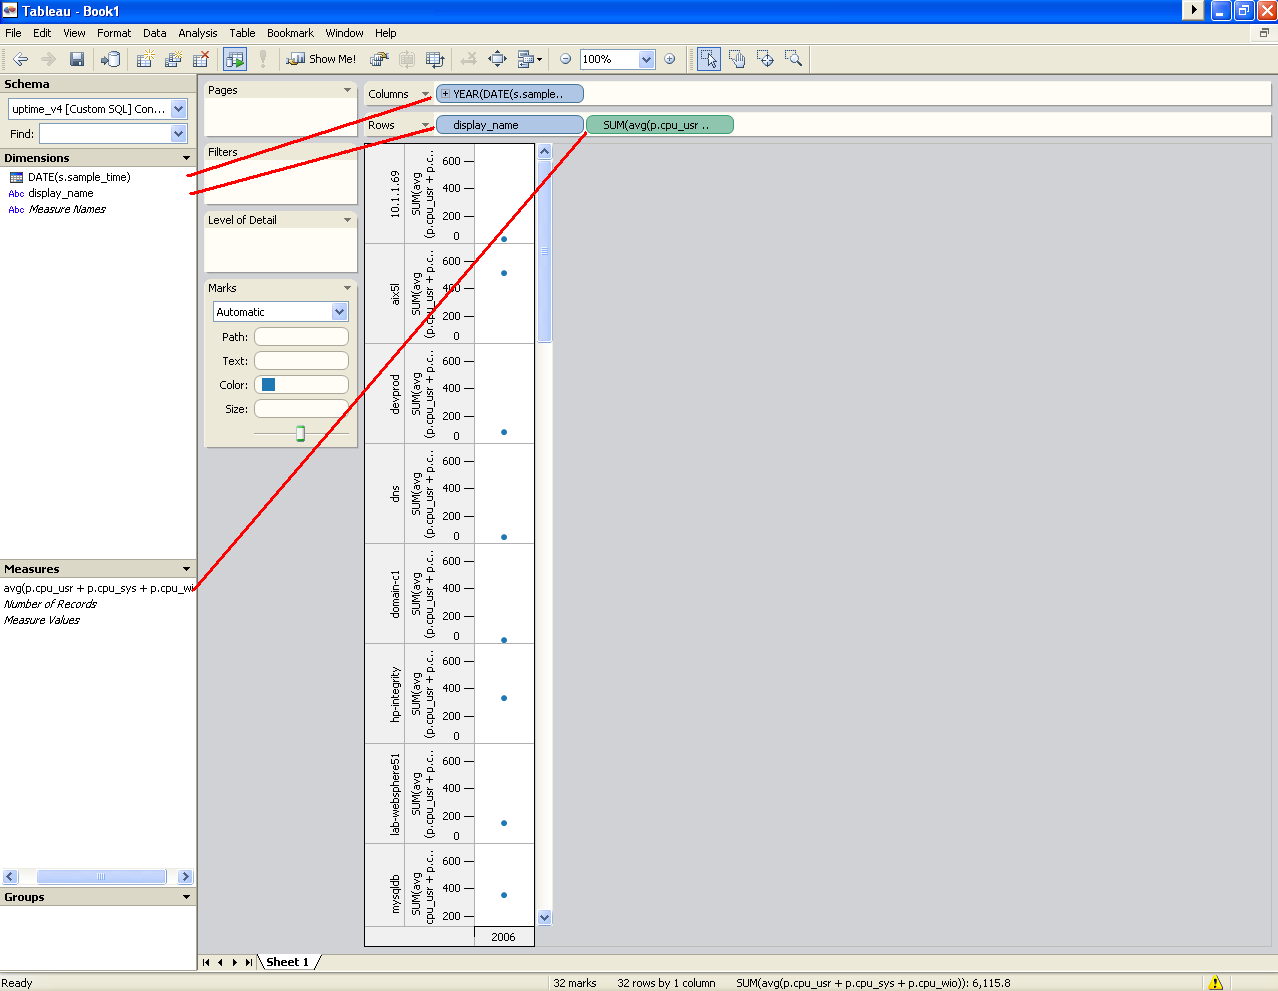
Modifying How the Report Displays Information You can quickly and easily change the information in a Tableau report to suit your needs, as illustrated below:
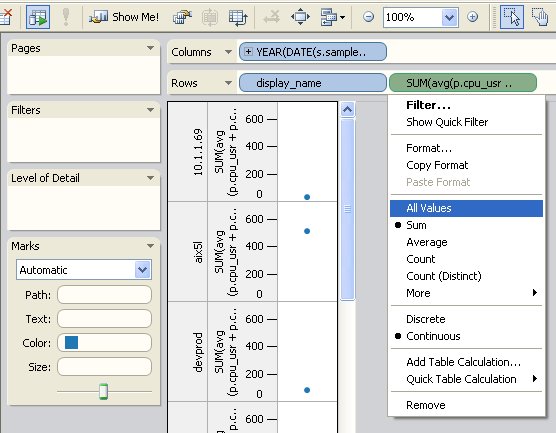
In the above example, To change this presentation, hold your mouse over any of the fields and click the arrow that appears on the right side of the field to open the following menu:
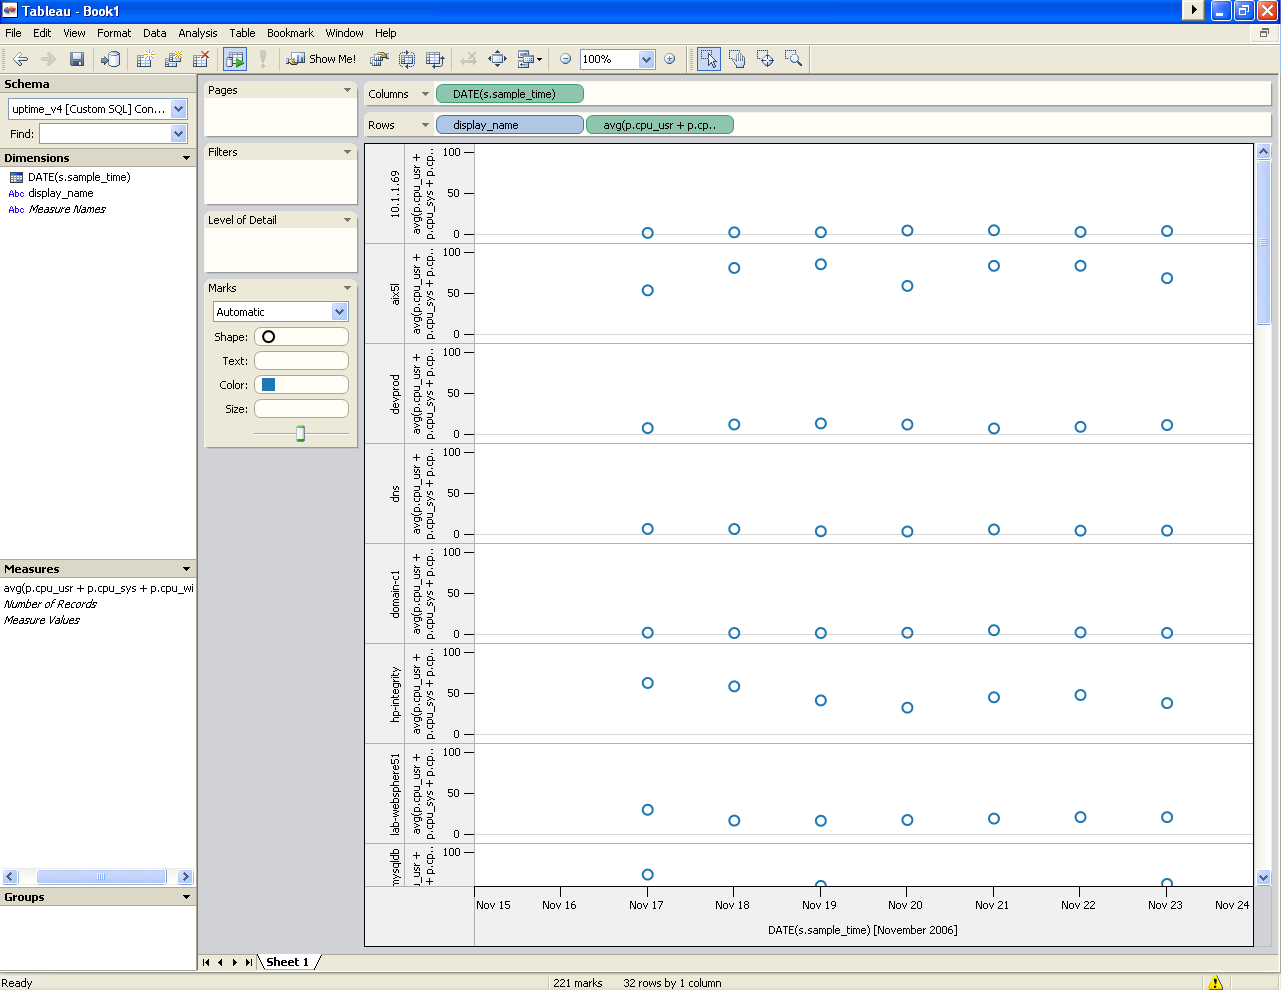
Select All Values from the menu for both the The following image illustrates a formatted Tableau report:
|
Article InfoIndex: 107 OptionsQuick Links |
Creating custom reports with Crystal Reports | Rating | Views | |
|---|---|---|---|
| |
Use Crystal Reports with up.time's DataStore to generate custom reports. By: uptime Support | Date Created: 11-28-2006 | Last Modified: 7-28-2011 | Index: 103 |
 
|
48401 |
Creating custom reports with Microsoft Reporting Service | Rating | Views | |
|---|---|---|---|
|
Learn how to query data from an MS SQL Server DataStore and create reports with Microsoft Reporting Services. By: uptime Support | Date Created: 1-3-2007 | Last Modified: 7-6-2011 | Index: 113 |

|
9086 | |
Creating Custom Service Monitors with Retained Data Collection | Rating | Views | |
|---|---|---|---|
| |
By: uptime Support | Date Created: 5-15-2006 | Last Modified: 12-16-2011 | Index: 067 |
|
13375 |
Creating Custom Alert Scripts in up.time Alert Profiles | Rating | Views | |
|---|---|---|---|
| |
By: uptime Support | Date Created: 5-17-2006 | Last Modified: 8-9-2011 | Index: 065 |
|
12867 |
Creating Custom Service Monitors in up.time | Rating | Views | |
|---|---|---|---|
| |
By: uptime Support | Date Created: 5-15-2006 | Last Modified: 6-26-2013 | Index: 066 |
|
24502 |