articleHow to monitor MySQL Databases with up.time

Contents

Monitoring the Network

The most critical component of any application is the network that surrounds it. To ensure that your network is available and running smoothly, we suggest monitoring the following components around your database server:
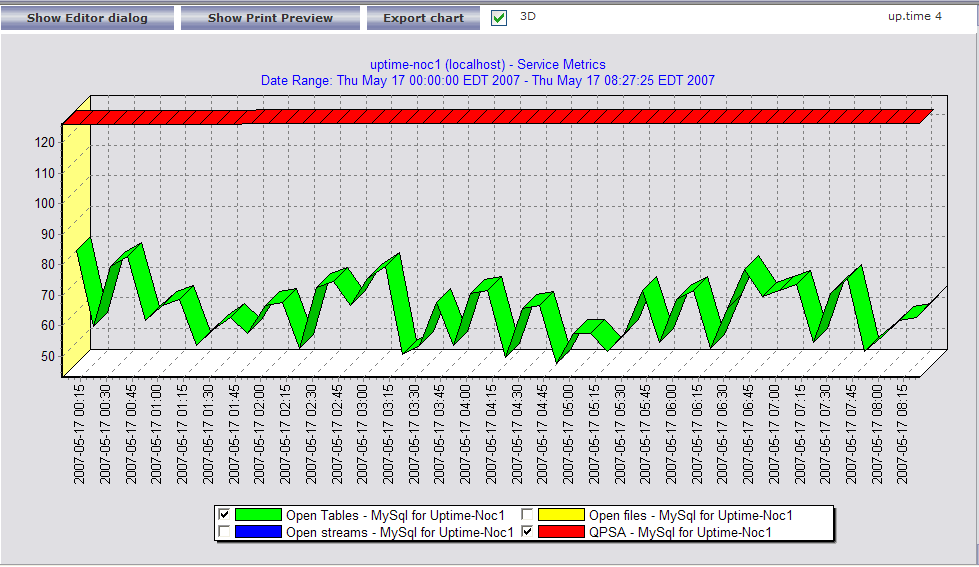
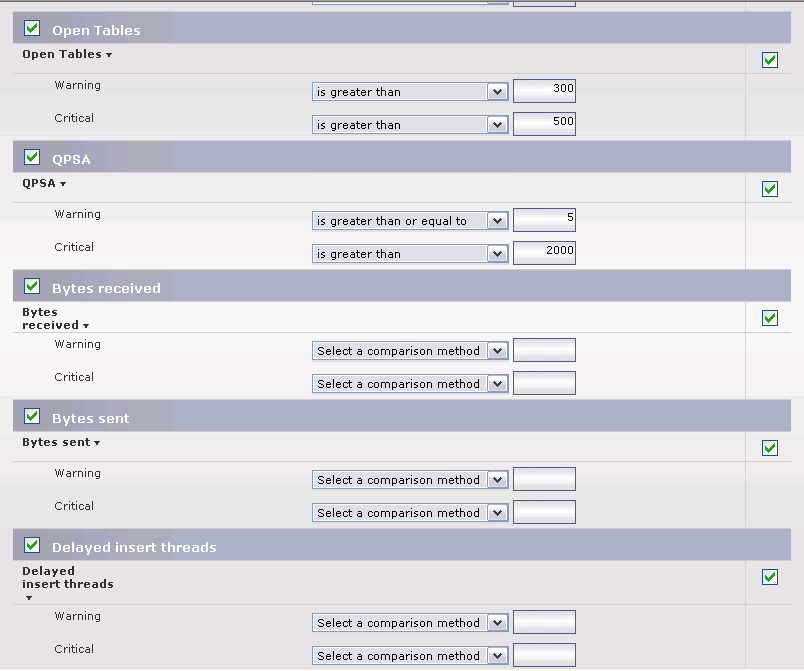
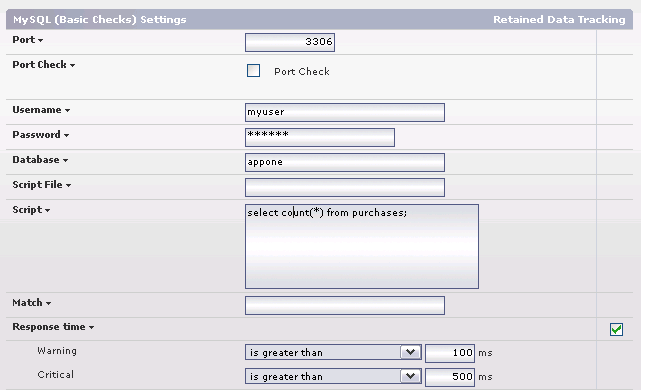
  • Monitor all Network Switches, Routers and Firewalls that are between your users and your database.
  • Use the DNS service monitor to ensure your database server name is resolving correctly.
  • Use the PING service monitor to ensure that your database server is responding to network requests.

Monitoring MySQL Databases

In this section we will review the monitors that are generally recommended to fully monitor your services.

Monitoring MySQL Database Performance

We recommend using the service monitors listed below to monitor the internal application performance of your database server.

  • MySQL (Advanced Metrics) Monitor. The MySQL (Advanced Metrics) service monitor provides detailed internal performance information from your database server. In an instanced environment you will need to add a single monitor to each instance (the monitor will track performance of all databases within any given instance). If you want to graph or report on internal database performance at a later date, be sure to click the Save for Graphing checkbox beside each statistic in the service monitor. For a full list of metrics available from the MySQL (Advanced Metrics) service monitor, please see the MySQL Advanced Metrics article. The following graph shows an example of MySQL performance statistics colected from an existing MySQL Advanced service monitor:


    The following example shows some important settings and thresholds in the MySQL (Advanced Metrics) Monitor:


    NOTE: Many thresholds within the MySQL (Advanced Metrics) service monitor will depend on the size and usage of your database server and each instance that is running on it. We suggest enabling the Save for Graphing option on each statistic and then letting the monitor collect data for 2 to 3 days. After that time, review the collected data to see how each statistic has trended over time, and pick thresholds that seem appropriate to your installation.


  • Performance Service Monitor. The Performance Service monitor will allow you to monitor the average CPU consumption of your critical database processes over time. We suggest that each database process have a Performance monitor dedicated to it. Each process should not consume more than an average of 70% of system CPU for a period greater than 15 minutes. Here are some example settings for the Performance Service monitor:

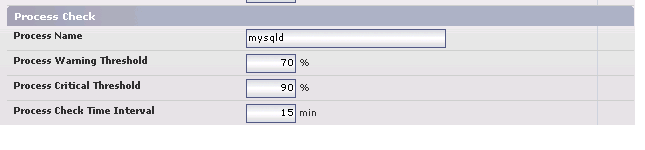
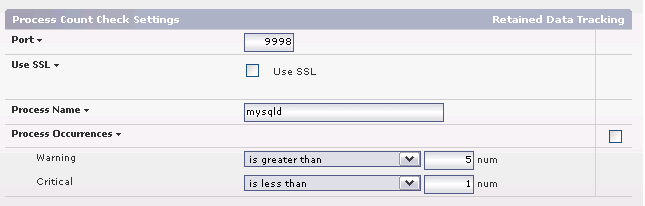
Monitoring MySQL Availability

  • MySQL (Basic Checks). This monitor allows you to verify that your MySQL database is responding to query requests by either executing a standard query or performing a simple port check against your server. This monitor also allows you to execute application-specific queries that may help you to evaluate end user experience problems if these set queries begin to slow down. The following example shows a configured MySQL (Basic Checks) monitor:

  • Process Count Monitor. The up.time Process Count Monitor can be configured to ensure that your database processes are present on the host system. We recommend setting thresholds indicating if 0 instances of the processes in the following table are found.

    Process Name Application Details
    mysqld The MySQL Daemon N/A
    safe_mysqld MySQL Wrapper Process Alternate: mysqld_safe
    mysql-nt Windows MySQL Daemon

    Here are some example settings to check for the mysqld process:

Monitoring the host server

Don't forget the value of monitoring the server that is hosting your databases. Monitoring and alerting on the performance of your servers will be critical to ensure that you maintain database availability and meet capacity demands. Monitoring on key performance indicators such as CPU Usage, Disk I/O, Network I/O and Memory usage is essential to ensure your servers are running properly.

Next Steps

Now that you are monitoring your MySQL Database Server it is time to move on to one of these next steps:

  • Report and Graph Saved (Retained) Application Metrics
  • Report Service Outages & Availability
  • Group monitors into an Application
  • Apply monitoring templates to many systems using Service Groups

Related Articles


Supported Databases in up.time

RatingViews
article

A list of databases supported in up.time 5.x

By: uptime Support | Date Created: 5-24-2011 | Last Modified: 4-7-2014 | Index: 516

  3357

MySQL Advanced Metrics

RatingViews
article

This article outlines the metrics collected by the up.time MySQL Advanced monitor.

By: uptime Support | Date Created: 1-26-2007 | Last Modified: 7-4-2011 | Index: 126

  4838

Securing the up.time MySQL Database

RatingViews
article

By: uptime Support | Date Created: 3-3-2006 | Last Modified: 7-28-2011 | Index: 058

  4051

MySQL Monitor error: Insufficient status data returned

RatingViews
article

Monitor: MySQL (Advanced Metrics) Status Message: ------------------------------------------------ Status: CRIT Message: Insufficient status data returned Response time: 437...

By: uptime Support | Date Created: 12-31-1969 | Last Modified: 8-31-2011 | Index: 287

  2641

Shrinking your MySQL DataStore

RatingViews
article

At times it may be necessary to reduce the disk space that your MySQL DataStore consumes on your monitoring station. The process of reducing your DataStore size follows the general steps that are...

By: uptime Support | Date Created: 7-31-2006 | Last Modified: 2-19-2014 | Index: 088

  11248

User Comments


No comments have been posted.

Copyright © 2021 IDERA, Inc.   Legal   Privacy Statement