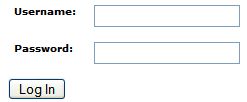
Users of Web sites often complain about difficulties with logging into those sites. The causes of those difficulties include user error and problems with Web server. Using up.time's HTTP (Web Services) monitor, you can monitor the page that users go to in order to login to a Web site. NOTE: The HTTP (Web Services) monitor does not monitor the page that actually processes the login.. Anatomy of the Login Page The login page will probably contain a form (denoted by the <form> tags) that describes how the fields on the page are used to process a user login. In a Web browser window, the login form will look something like this:
The following is the HTML code for the form illustrated above:
<table width="100%" border="0" cellspacing="0" cellpadding="0">
     <form method="POST" action="login.aspx">
      <input type='hidden' name='state' value='LOGIN'>
        <tr>
               <td align='left' valign='top' nowrap>
                Username:
               </td>
              <td valign='top'>
                <input type='text' name='user' id='user' class='loginEntries' value='' maxlength='256'>
              </td>
           </tr>
          <tr'>
              <td align='left' valign='top' nowrap>
                Password:
                </td>
              <td valign='top'>
                <input type='password' name='password' id='password' class='loginEntries' value=''>
              </td>
            </tr>

             <tr valign='middle'>
                <td align='right' colspan='2'>
                  <input type='submit' name='login' value='Log In' title="Click this button to log in.">
              </td>
              </tr>
  </form>
</table>
The variables that are needed to configure the monitor are enclosed in the blue <form> tags. The green POST variable indicates the HTTP POST function will be used in the service monitor instead of the GET function. The green login.aspx is the actual page on the Web server that will be monitored by the HTTP service monitor. The red variables are the POST variable settings that will be entered into the monitor template. Monitoring the Login Page To monitor a login page, do the following:
|
Article InfoIndex: 074 OptionsQuick Links |
How do I register and login to the online User Community? | Rating | Views | |
|---|---|---|---|
| |
1. Go to the uptime website (http://www.uptimesoftware.com or http://support.uptimesoftware.com) and click on the Community Forums tab at the top. 2. NOTE: If you have previously registered to... By: uptime Support | Date Created: 2-3-2009 | Last Modified: 8-25-2011 | Index: 367 |
 
|
3738 |
How to exclude file systems from the GlobalScan page | Rating | Views | |
|---|---|---|---|
| |
To exclude file systems from the GlobalScan go through these steps for each agent system that you would like to exclude file systems from. - Browse to the element using My Enterprise - Under the... By: uptime Support | Date Created: 10-14-2009 | Last Modified: 8-13-2011 | Index: 434 |
|
2353 |
Monitoring and Graphing user workload | Rating | Views | |
|---|---|---|---|
| |
Use the user workload graph to track increases in user workload on a server. By: uptime Support | Date Created: 12-19-2006 | Last Modified: 7-5-2011 | Index: 109 |
|
3953 |
Can not login to up.time | Rating | Views | |
|---|---|---|---|
| |
There are several possible problems that would stop you from being able to login to up.time. 1 - Your browser does not allow cookie's. 2 - The up.time Apache server is not able to create a... By: uptime Support | Date Created: 12-31-1969 | Last Modified: 8-31-2011 | Index: 275 |
|
2937 |
Login Problems | Rating | Views | |
|---|---|---|---|
| |
If you are trying to login to http://support.uptimesoftware.com you must use your personal email address and password that was set for you during the registration process. If you need to lookup... By: uptime Support | Date Created: 8-5-2010 | Last Modified: 8-13-2011 | Index: 462 |
|
2102 |