|
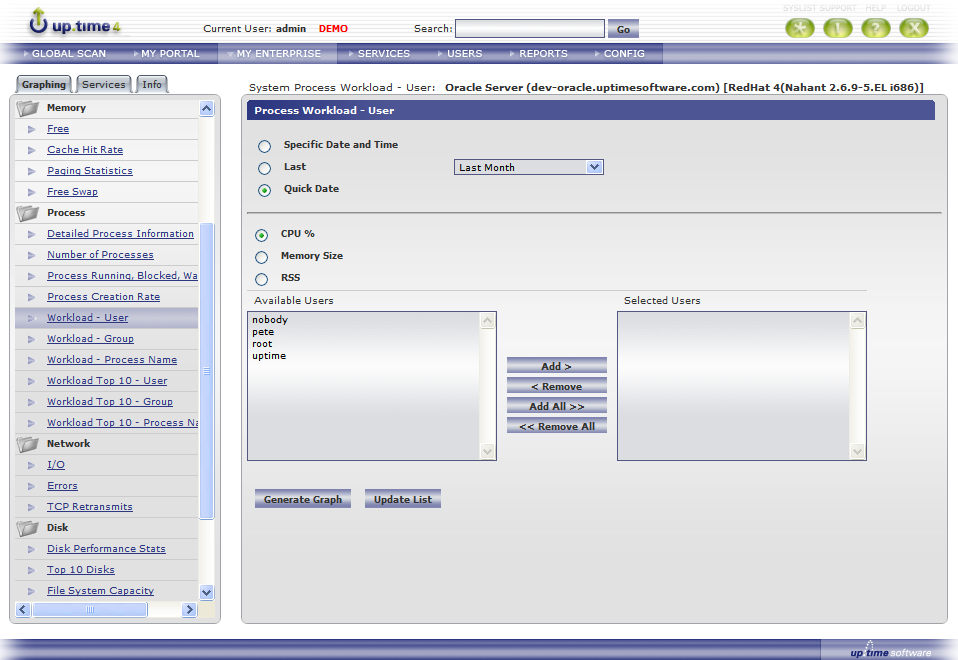
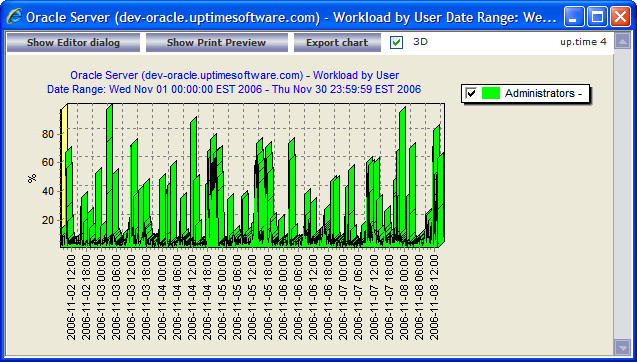
A user workload graph provides a visualization of how particular processes behave over time. Rather than viewing several detailed pieces of information about a particular process, you can graph an aggregate amount of performance information for its intended use. For example, by using this graph to track increases in user workload on a database server, you can help to determine if there is a problem accessing the database or performing queries in a timely manner. The following example demonstrates how to graph user workload on an Oracle database server. To generate a user workload graph, complete the following steps:
|
Article InfoIndex: 109 OptionsQuick Links |
IE Blocks an ActiveX Control During Graphing | Rating | Views | |
|---|---|---|---|
| |
A solution to prevent Internet Explorer from presenting ActiveX component security warnings when it should not be displaying them. By: uptime Support | Date Created: 7-14-2009 | Last Modified: 6-14-2011 | Index: 375 |
  
|
3707 |
ESX Instance Workload Data | Rating | Views | |
|---|---|---|---|
| |
This article outlines the metrics that up.time collects from the instances on ESX systems. By: uptime Support | Date Created: 1-23-2007 | Last Modified: 7-4-2011 | Index: 120 |
|
6317 |
Monitoring a User Login Web Page | Rating | Views | |
|---|---|---|---|
| |
By: uptime Support | Date Created: 6-5-2006 | Last Modified: 12-31-1969 | Index: 074 |
|
14291 |
How do I graph AIX workload? | Rating | Views | |
|---|---|---|---|
| |
To generate an ESX Workload graph, do the following after adding your ESX server to up.time for monitoring: 1. In the Global Scan or My Enterprise panel, click the name of the pSeries server which... By: uptime Support | Date Created: 1-30-2009 | Last Modified: 8-25-2011 | Index: 353 |
|
3642 |
How do I graph LPAR workload? | Rating | Views | |
|---|---|---|---|
| |
To generate an LPAR Workload graph, do the following after adding your LPAR to up.time for monitoring: 1. In the Global Scan or My Enterprise panel, click the name of the pSeries server which is... By: uptime Support | Date Created: 12-31-1969 | Last Modified: 8-26-2011 | Index: 326 |
|
4192 |