|
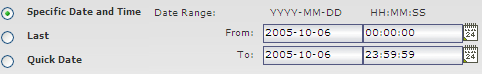
When configuring graphs or reports, you must specify a range of dates and times over which the graph or report will chart information. up.time will only display information for the periods that you specify. Date and time ranges are set in the Date Range area of the Reports and Graphing subpanels, as shown below:
Choose one of the following options to set dates and times for a graph or report:
|
Article InfoIndex: 216 OptionsQuick Links |
HTTP service monitor times out but still returns OK | Rating | Views | |
|---|---|---|---|
| |
the http check will return OK if the service monitor times out and the text search criteria is "contains:" because the text to search for was not found so a WARN or CRIT threshold wasn't reached.... By: uptime Support | Date Created: 10-8-2009 | Last Modified: 8-13-2011 | Index: 394 |
 
|
2492 |
Understanding the Status of Services | Rating | Views | |
|---|---|---|---|
| |
This article explains the status of the services that are displayed in the GlobalScan panel By: uptime Support | Date Created: 9-6-2007 | Last Modified: 6-28-2011 | Index: 213 |
|
4434 |
Understanding and Using Retained Data | Rating | Views | |
|---|---|---|---|
| |
This article explains how to use data that is optionally retained by up.time service monitors. By: uptime Support | Date Created: 7-19-2007 | Last Modified: 6-28-2011 | Index: 196 |
|
3531 |
Understanding your Oracle Connection Settings | Rating | Views | |
|---|---|---|---|
| |
This article outlines how you can use the information in the Oracle TNS connection string to populate database-specific fields that need to be set in the uptime.conf file. By: uptime Support | Date Created: 2-27-2007 | Last Modified: 6-30-2011 | Index: 146 |

|
6929 |
'Default up.time data store' monitor crit after adding a vCenter ... | Rating | Views | |
|---|---|---|---|
| |
As part of the initial install of up.time, the Monitoring Station itself is setup as an element within up.time. This sample element is initially setup to use localhost as it's hostname, along... By: uptime Support | Date Created: 3-8-2013 | Last Modified: 3-8-2013 | Index: 592 |
|
3613 |