|
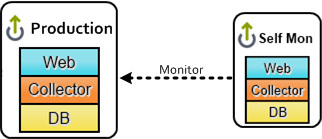
Article Contents The purpose of this article is to outline a few implementation options that provide high availability to an up.time environment. The options shown are sample configurations that customers have deployed and are not the only options available. Which option to choose will largely depend on the desired level of availability and redundancy. If the following does not suit your environment or if there are any questions, please contact [email protected]. Each option has an up.time instance called Self Monitor. The sole purpose of Self Monitor is to monitor vital health and performance information of up.time and execute any self-healing actions if needed. It is tuned to consume very little resources. up.time Overseer
The goal of this option is to ensure the availability of the production up.time instance by configuring a Self Monitor instance. Alerts will be sent out when the production instance is down or degraded. Moreover, self-healing actions can be performed to minimize downtime of the production instance. This option will ensure the production instance does not silently become unavailable. The advantage of this option is it's simple to setup and it's cost-effective. The downside is it does not offer any redundancy. However, it does provide alerts and self-healing capabilities that would increase up.time availability. Partial Redundancy
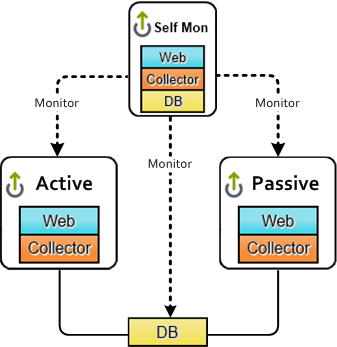
In addition to Self Monitor monitoring the production instance of up.time, this option consists of a Passive instance on standby. The Active and Passive instances share a single database so that the configuration and historical data will be consistent. Self Monitor monitors whether the Active instance is available and when it's unavailable, Self Monitor will execute actions to failover to the Passive instance by starting the up.time services. Self Monitor also monitors the database so alerts will be sent when it's unavailable and self-healing actions can be executed. This option is in the middle of the pack in terms of availability, simplicity and budget-friendly. It offers redundancy by having a Passive instance of up.time on standby. When needed, up.time can failover to the Passive instance. The single point of failure is the database in this option. One needs to be cautious and make certain the database is backed up regularly. Full Redundancy
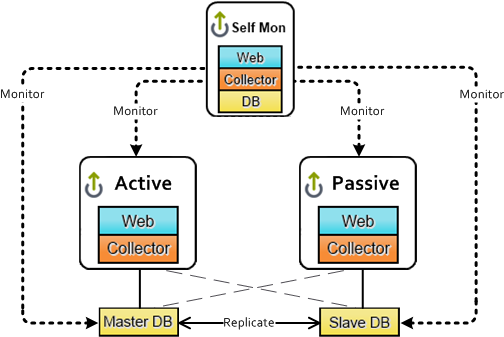
This option not only has redundant instances of up.time, it also utilizes redundant databases. Similar to the previous option, Self Monitor monitors the Active and Passive instances of up.time and the databases. The Master database is connected to the Active instance and the data is replicated to the Slave database. A few failover scenarios can occur:
As with the other options, alerts will be sent out if any of the components are down or degraded and self-healing actions can be executed to attempt to recover prior to failover. This option offers the most redundancy due to the pair of up.time instances and the pair of databases. However, with redundancy comes complexity and cost. There is more to configure and one will need more servers to implement such a configuration. Summary
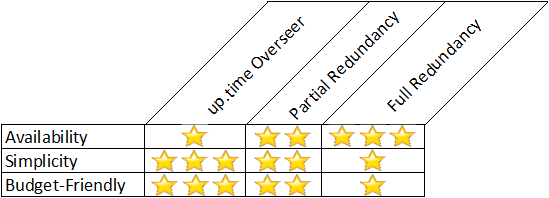
The above chart summarizes how each of the options compares to each other. Any of the options can be used and/or customized to meet the requirements. If there are any questions, please contact [email protected]. |
Article InfoIndex: 590 OptionsQuick Links |
Application Availability Does Not Match Average Status of Service... | Rating | Views | |
|---|---|---|---|
| |
By: uptime Support | Date Created: 7-9-2007 | Last Modified: 6-28-2011 | Index: 192 |
 
|
4856 |
How do I generate server & application availability reports? | Rating | Views | |
|---|---|---|---|
| |
1. Click on the Reports tab. 2. Click on Application Availability on the left tree menu. 3. Select the date/time range and the Application(s) you want to report on. 4. Select the report output type. By: uptime Support | Date Created: 2-3-2009 | Last Modified: 8-25-2011 | Index: 360 |
|
4263 |
up.time does not start - Java heap size too high | Rating | Views | |
|---|---|---|---|
| |
If the up.time 4 Data Collector fails to start and messages like those below are found in the wrapper.log you may have to adjust your java heap size to a lower value. wrapper.log: ........ STATUS... By: uptime Support | Date Created: 10-10-2009 | Last Modified: 8-13-2011 | Index: 422 |
|
3398 |
Why is up.time server load so high at the start of the month? | Rating | Views | |
|---|---|---|---|
| |
At the start of each month the up.time data archiving process initiates to clear out old data from your DataStore. This can be a very resource heavy operation and may take a great deal of time to... By: uptime Support | Date Created: 8-7-2010 | Last Modified: 8-10-2011 | Index: 469 |
|
2913 |
High CPU Usage on Windows Agent | Rating | Views | |
|---|---|---|---|
| |
If you observe high CPU usage on systems running the Windows agent, try disabling unused counters (e.g. IIS, SQL, Exchange, etc.) and then restart the agent. If this does not resolve the issue,... By: uptime Support | Date Created: 7-12-2011 | Last Modified: 8-11-2011 | Index: 542 |
|
3922 |