article Creating Custom Service Monitors with Retained Data Collection

Related Documentation Version of up.time affected Affected Platforms
This article is part of a series:

Part 1 - Creating Custom Service Monitors in up.time
Part 2 - Creating Custom Service Monitors with Retained Data Collection
Part 3 - Creating Plug-in Service Monitors in up.time
All All

Article Contents


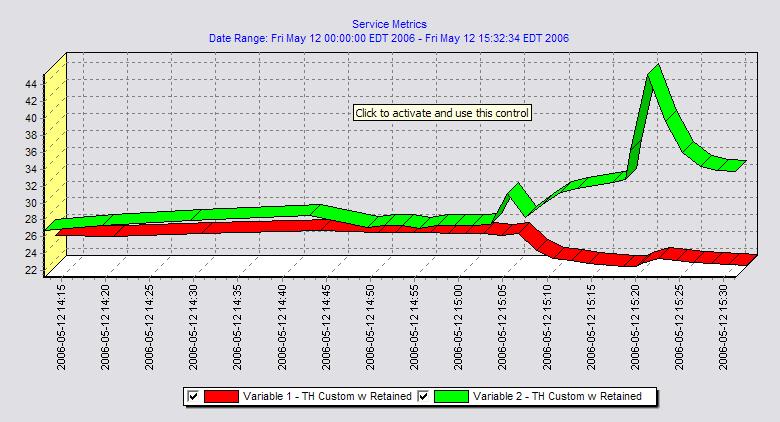
Overview

Custom service monitors with retained data tracking expand on the basic Custom service monitor by allowing you to retain and graph historical trending information returned from your custom script. This enables you to store up to 10 custom application or business metrics per monitor within up.time just like system performance metrics returned by the up.time agent. This article builds on the scripts and knowledge that were developed in a previous article. Take some time to review the previous article before continuing.

Example graph produced using a custom service monitor with retained data.


Formatting your monitoring station script for retained data tracking

To use a custom script with retained data with up.time, you must change the output format produced by your script. All of the rules found in a regular custom service monitor still apply with a few slight modifications, as detailed below:

  1. The monitoring station script must return a single number (decimal or integer) per line -- one line for each metric that you want to up.time to retain. You can have a maximum of 10 lines retained. The example script output shown below retains the values '10.5' and '99' as two distinct graphable trends within up.time:

    > check_temp.sh
    10.5
    99

  2. The output must be in numeric format; you cannot have text output. This enables the service monitor to perform all threshold checking within up.time instead of having your script determine thresholds and return an outage message in text format.
  3. The script must exit with a success status (0), unless there has been a problem when the script is run or if you want to force a status for the service monitor.
  4. The script must accept the hostname of the agent system as the first argument. up.time will automatically add this argument to the arguments passed to your script.
  5. In general, you do not need to change to your existing agent side script or configuration in order for your service monitor to retain performance metrics.

Changing the check_temp script for retained data

Using the check_temp.sh script as a basis for this example, you can easily change the script to fit within the context of a custom service monitor with retained data. To do this, you must make the following changes to the script:

  1. Remove the logic included within the script to check the temperature and humidity thresholds.
  2. The output that is produced by the script will be changed to output the current temperature level on a single line followed by the current humidity. Here is an example of how our output and command format will change.

    Previous Format - For a regular custom service monitor.
    > ./check_temp.sh test-agent 9998 temp 60 80
    WARNING - temperature is 64.5 on test-agent
    > ./check_temp.sh test-agent 9998 rh 25 30
    CRITICAL - humidity is 32.8 on test-agent


    New Format - For a custom service monitor with retained performance data.
    > ./check_temp.sh test-agent 9998
    64.5
    32.8

To produce the output listed above, you must edit the script so that it looks like the following example:

#!/bin/sh

# This script takes the following arguments:
# check_temp.sh hostname port
# Example execution:
# ./check_temp.sh my-agent 9998

# This script can be placed anywhere on the monitoring station system as long as it is
# executable by the uptime user.

#First, collect our arguments
AGENT=$1
PORT=$2

TMPFILE=/tmp/$$.temp

# now use the info above to contact our agent, store the output in a file for parsing
`echo -n rexec secretpassword /opt/uptime-agent/my-scripts/show_temp.sh my-arguments | /usr/local/uptime/bin/netcat $AGENT $PORT > $TMPFILE`

Note: If you are using agentcmd instead of netcat, replace netcat with agentcmd in the command above. For example:

`echo -n /opt/uptime-agent/my-scripts/show_temp.sh my-arguments | /usr/local/uptime/scripts/agentcmd -p $PORT $AGENT rexec secretpassword > $TMPFILE`

For more information on the syntax used with agentcmd, see this Knowledge Base article.

# we have the output from the agent. If it is ERR that means there was a problem running the script on the agent
`grep ERR $TMPFILE`
if [ $? -eq 0 ]
then
echo "Could not execute agent side script!"
# by exiting with a 2 we are forcing a CRIT service outage
exit 2
fi

# in this script we don't need to check thresholds or determine which information to check
# we just need to reformat the agent side script output slightly so that only numerical info is displayed
# we do this by trimming off the first word returned on each line from the agent, leaving just the numbers
# and printing that to screen, up.time will handle the rest

awk '{print $2}' $TMPFILE

exit 0


Adding Custom Service Monitor with Retained Data to up.time

Next, add your custom service monitor with retained performance metrics to the up.time Web interface using the same process that you would use to add a standard custom service monitor to up.time. The Custom with Retained Data monitor option is found in the List Other Monitors section of the Add New Service Instance page.

The Custom with Retained Data service monitor template has the following monitor-specific settings:

Option Name Description Example
Script Name The script name is the path to your monitoring station script, this is the script that up.time will execute when running this service monitor. Be sure to use the complete path wherever possible and that the path is to a locally mounted volume. For Windows script paths you must use UNIX style directory separators (/ instead of ) and also place double quotes around the entire script name UNIX/Linux Example:
/usr/local/uptime/check_temp.sh

Windows Example:
"C:/my scripts/check_temp.bat"
Arguments These are the arguments that you would like up.time to pass into your monitoring station script. No arguments are required but please be aware that up.time will automatically include the selected hostname as the first argument to your script. temp 60 80
Variable 1-10 Warning This is the warning threshold used against the output returned from your monitoring station script. This is a numeric comparison. You must select both a comparison method and a threshold value to enable the warning level threshold Output contains: "warning"
Variable 1-10 Critical This is the critical threshold used against the output returned from your monitoring station script. This is a numeric comparison. You must select both a comparison method and a threshold value to enable the critical level threshold Output contains: "critical"
Retained Data Tracking This check box determines if up.time will not only check the variable for threshold violations but will also retain the returned values for graphing at a later time. In most cases you should check this box, without it data for the indicated variable will not be retained for graphing. N/A

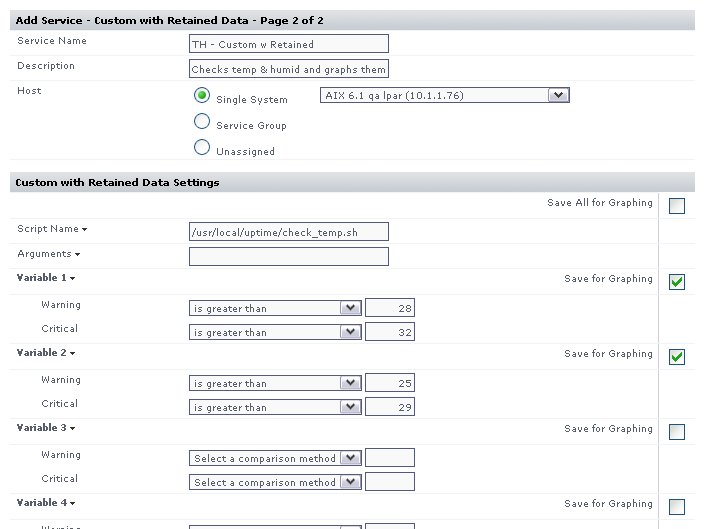
Based on the settings used in the example monitoring station script, configure the monitor with the following setting:

  • Enter a name and description for the monitor.
  • Select a host from the dropdown menu. Be sure to select the same host that your agent side script is on
  • In the Script Name field, enter the path to the custom script on your monitoring station. On Windows systems be sure to use UNIX style / instead of and put quotation marks around your path. For example: "C:/my files/check_temp.bat"
  • In the Arguments field, enter the arguments for the script. up.time adds the agent name as the first argument automatically so do not include it.
  • Select contains from the Warning dropdown and enter WARNING as the search text.
  • Select contains from the Critical drop down and enter CRITICAL as the search text.
  • Complete the remainder of the monitor template as you would for a normal service monitor.

Example monitor configuration

The image below illustrates a sample monitor configuration. This service monitor will indicate a WARN or CRIT whenever the monitoring station custom script returns WARNING or CRITICAL in its output.

Related Articles


Creating Custom Service Monitors in up.time

RatingViews
article

By: uptime Support | Date Created: 5-15-2006 | Last Modified: 6-26-2013 | Index: 066

  22369

How to get custom script retained data values

RatingViews
article

Integer Data SELECT e.name,p.name,d.value,d.sampletime FROM erdc_int_data d, erdc_instance e, erdc_parameter p where e.erdc_instance_id = d.erdc_instance_id and p.erdc_parameter_id =...

By: uptime Support | Date Created: 10-10-2009 | Last Modified: 8-10-2011 | Index: 425

  2634

Creating Plug-in Service Monitors in up.time

RatingViews
article

By: uptime Support | Date Created: 5-15-2006 | Last Modified: 12-16-2011 | Index: 068

  60983

Understanding and Using Retained Data

RatingViews
article

This article explains how to use data that is optionally retained by up.time service monitors.

By: uptime Support | Date Created: 7-19-2007 | Last Modified: 6-28-2011 | Index: 196

  2790

Using retained service metrics data to generate graphs

RatingViews
article

Yes it is definitely possible to graph and even report on the data that is collected. First, you need to make sure that in the service monitor that you have the Retained Data checkboxes checked,...

By: uptime Support | Date Created: 10-8-2009 | Last Modified: 8-13-2011 | Index: 398

  2326

User Comments


No comments have been posted.

Copyright © 2021 IDERA, Inc.   Legal   Privacy Statement