|
Article Contents
Overview Plug-in service monitors allow you to add service monitors directly into the up.time interface. You can use plug-in service monitors to check, alert on and graph your own custom application or business metrics. Plug-in in monitors have the following benefits:
Example graph produced using a plug-in
monitor. The process of updating your existing scripts and service monitors to be plug-in monitors can usually be completed in just a few minutes. This article builds on the scripts and knowledge that were developed in previous articles. Take some time to review the previous articles before continuing. Formatting your monitoring
station script for retained data tracking To format your custom script for use with a plug-in monitor, you will only need to make changes to the way that it outputs information when the script is run. Instead of printing a number to screen on individual lines -- like the Custom with Retained Data -- you must also print a variable name along with the numerical or string value. Choosing a variable name is the most important part of setting up the plug-in monitor. The variable name must be exactly the same within your script output and the XML definition for your service monitor. This is discussed later in this article. The format of plug-in monitor output is included below along with an example set of output that includes two integer variables (transactions and users) and two string values (lasterror and connectmsg). The output format is a simple name and value pairing, the variable naming coming first on a line and the value for that variable following it. Expected format: Changing the check_temp script
for use within a plug-in service monitor Using the check_temp.sh script as an example, change the output format so that it can be used within a plug-in monitor. You must first decide what to call the variables that the script will output. Currently, the script outputs temperature and relative humidity -- name the two variables temp and rh. Next, change the output of the script check_temp.sh as detailed below:
Previous Format - For a custom service monitor with retained
performance data.
New Format - For use within a plug-in service monitor, notice that we
have added our variable names to the output lines: If you look back through the examples in previous articles, you will notice that the output format from the monitoring station script above now matches that of the agent side script. Note that this is not always the case, but works well for this example. In order for the check_temp.sh script to produce the output listed above, edit the script so that it matches the example below:
#!/bin/sh Note: If you are using agentcmd instead of netcat, replace netcat with agentcmd in the command above. For example:
For more information on the syntax used with agentcmd, see this Knowledge Base article.
# we have the output from the agent. If it is ERR that means there was a problem running the script on the agent Creating the XML definition for
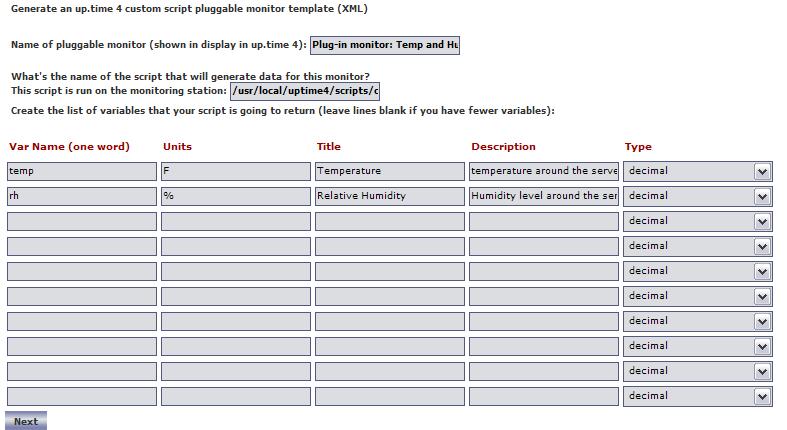
your plug-in service monitor To integrate the plug-in monitor with up.time, you must produce an XML definition that up.time will use to understand how to process your custom script and what options should be displayed within the up.time interface. To create your XML definition browse to the Plug-in Service Monitor XML Generation Tool and follow the steps on screen. This page will be your primary tool to create and edit your XML definition files. If you want to further customize the XML definition of your plug-in monitor, please contact [email protected]for assistance. Before you use the XML Generation Tool, have the following information about your plug-in monitor available:
Once you have generated your XML file, save it to your monitoring station in the UPTIME_DIRxml folder and continue to the next step. Below is an example screen shot of the options used to create an XML definition for the check_temp.sh script. The XML file that these options produce is attached to this article. Example options used to produce XML for
check_temp.sh. Importing and managing your XML
plug-in monitor definition Now that you have both the XML definition for your custom script and your custom script in place, you can import your plug-in monitor into up.time. You use the erdcloader and erdcdeleter to import and export your plug-in monitor. Examples of the options for these commands are included below. The UPTIME_DIRscriptserdcloader utility is used to import
your plug-in monitor XML definition as a service monitor template
within up.time.
Example Execution:
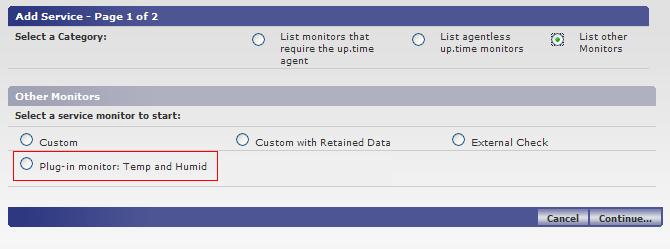
Example Execution: > cd UPTIME_DIR Now that the plug-in monitor has been imported, you can browse to the Add Service Instance page in the up.time user interface and see the plug-in monitor listed, as shown below:
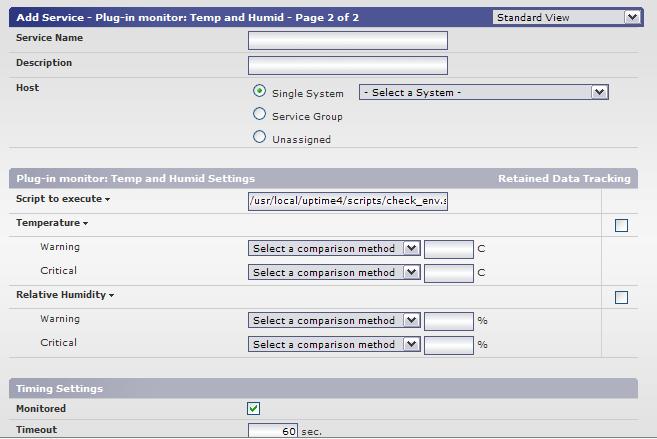
Adding Instances of your plug-in service monitor To add an instance of your plug-in service monitor, browse to the Add Service Instance list, select your plug-in service monitor, and click Continue. The options displayed on the monitor template match the definition that you created with the XML generation tool. The service monitor settings that would appear based on the example XML definition are shown below:
|
Article InfoIndex: 068 OptionsQuick Links |
Creating Custom Service Monitors in up.time | Rating | Views | |
|---|---|---|---|
| |
By: uptime Support | Date Created: 5-15-2006 | Last Modified: 6-26-2013 | Index: 066 |
 
|
24477 |
Creating Custom Service Monitors with Retained Data Collection | Rating | Views | |
|---|---|---|---|
| |
By: uptime Support | Date Created: 5-15-2006 | Last Modified: 12-16-2011 | Index: 067 |
|
13340 |
Expanding up.time's Capabilities with Plug-in Monitors | Rating | Views | |
|---|---|---|---|
|
Plug-in monitors allow up.time clients to expand their monitoring scope and functionality. This article lists some of the available plug-in monitors. By: uptime Support | Date Created: 9-18-2007 | Last Modified: 8-5-2013 | Index: 218 |

|
62313 | |
Changing the default service monitors (PING or UPTIME) | Rating | Views | |
|---|---|---|---|
| |
Currently there is no way to change the default service monitors that are added to an element when it is added to up.time. Monitors can be mass-edited using direct ODBC commands after systems are... By: uptime Support | Date Created: 12-31-1969 | Last Modified: 8-10-2011 | Index: 244 |
|
4695 |
Application Availability Does Not Match Average Status of Service... | Rating | Views | |
|---|---|---|---|
| |
By: uptime Support | Date Created: 7-9-2007 | Last Modified: 6-28-2011 | Index: 192 |
|
4859 |