|
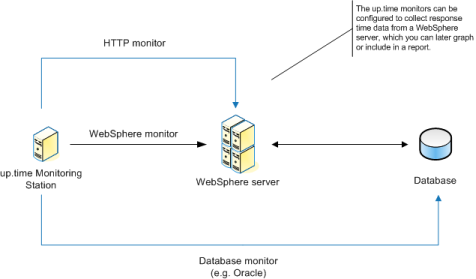
up.time provides the capability to monitor the performance and health of Java applications that are running on a WebSphere server. Use up.time to identify correlations between system performance and the Java application server, track end-user and database response times, and monitor a range of WebSphere server statistics. The following diagram provides a high-level illustration of how up.time monitors a WebSphere Application Server:
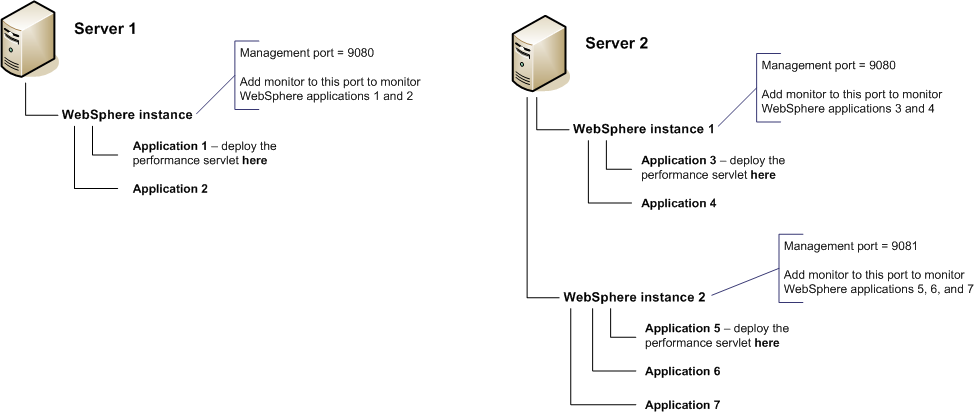
Deploying the WebSphere Servlet Before up.time can begin collecting information from a WebSphere server, you must first deploy the performance servlet in the WebSphere directory that contains your web application. The WebSphere performance servlet uses WebSphere's Performance Monitor Interface (PMI) infrastructure to retrieve performance information from a WebSphere Application Server. The following diagram provides an example of where to install the WebSphere performance servlet (click the diagram for a larger view):
Follow these steps to deploy the performance servlet:
Configuring up.time to monitor WebSphere The up.time WebSphere monitor collects data that you can use to generate a report that will provide a historical view of problems that occur on a WebSphere server. The monitor enables you to collect data so that you can:
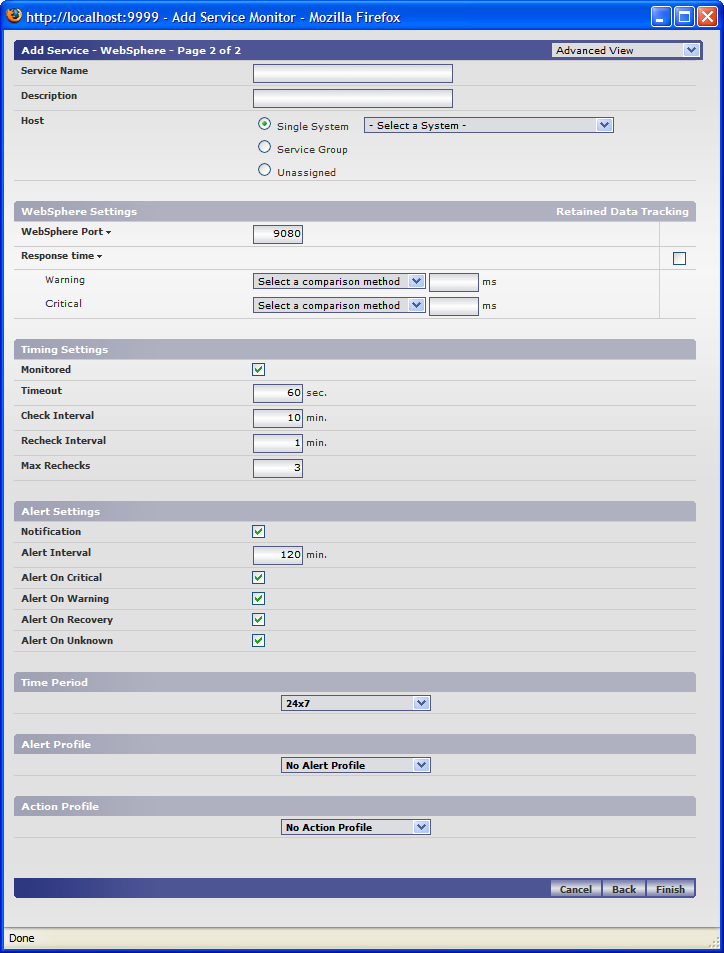
In up.time's WebSphere monitor definition window, point up.time to the physical server on which WebSphere is running and to the port on which the WebSphere Application Server is listening:
The WebSphere monitor automatically collects over 20 system level performance counters. See WebSphere Support in up.time for an overview of available counters or Configuring WebSphere Monitors in the up.time User Guide for details on how to configure the WebSphere monitor. Note that you can also use the up.time HTTP and database monitors to collect information on the status of applications that are running on a WebSphere server. See the Database Monitors and Network Service Monitors chapters in the up.time User Guide for more information. After up.time has collected a sufficient amount of information from a WebSphere server, you can use the WebSphere report to gain insight into the health and performance of a WebSphere Application Server. Reports can be configured to include any or all of the following metrics:
For more information, see the WebSphere Report section in the up.time User Guide. You can also use the following up.time Graphs to visualize the performance of applications that are running on a WebSphere server:
For more information on configuring and using graphs, see Understanding Graphs and Using Graphs in the up.time User Guide. |
Article InfoIndex: 108 OptionsQuick Links |
Enabling the IBM WebSphere service monitor | Rating | Views | |
|---|---|---|---|
| |
Before up.time can monitor a WebSphere server, you need to deploy the WebSphere performance servlet. By: uptime Support | Date Created: 10-2-2006 | Last Modified: 7-29-2011 | Index: 096 |
 
|
14734 |
How to configure WebSphere 6.1 for basic monitoring | Rating | Views | |
|---|---|---|---|
| |
- Login to Websphere Admin console - Click Applications->Install New Application - Choose "Remote File System", and enter either C:\Program... By: uptime Support | Date Created: 10-6-2009 | Last Modified: 8-13-2011 | Index: 385 |
|
3842 |
How to configure WebSphere 6.0 for basic monitoring | Rating | Views | |
|---|---|---|---|
| |
- Login to Websphere Admin console - Click Applications->Install New Application - Choose "Remote File System", and enter either C:\Program... By: uptime Support | Date Created: 10-8-2009 | Last Modified: 8-13-2011 | Index: 401 |
|
2971 |
WebSphere Performance Metrics | Rating | Views | |
|---|---|---|---|
| |
This article outlines the performance metrics that up.time collects from a WebSphere Application Server. By: uptime Support | Date Created: 1-30-2007 | Last Modified: 6-30-2011 | Index: 137 |

|
5942 |
up.time not collecting all WebSphere performance statistics | Rating | Views | |
|---|---|---|---|
| |
In WebSphere 5.xx you will need to have the PMI level set to Maximum in order for you to get all the stats for uptime by following the directions at the url located below:... By: uptime Support | Date Created: 10-10-2009 | Last Modified: 8-13-2011 | Index: 424 |
|
2610 |